City-Wide IoT Monitoring with GIS Visualisation
Give city operations teams a single view of infrastructure across every district — sensors, street lighting, environmental monitors, parking, and more — on a live GIS map. Monitor conditions in real-time, respond to alerts with geographic context, and manage city-wide IoT from one unified platform.
Visualise Your Entire City on One Map
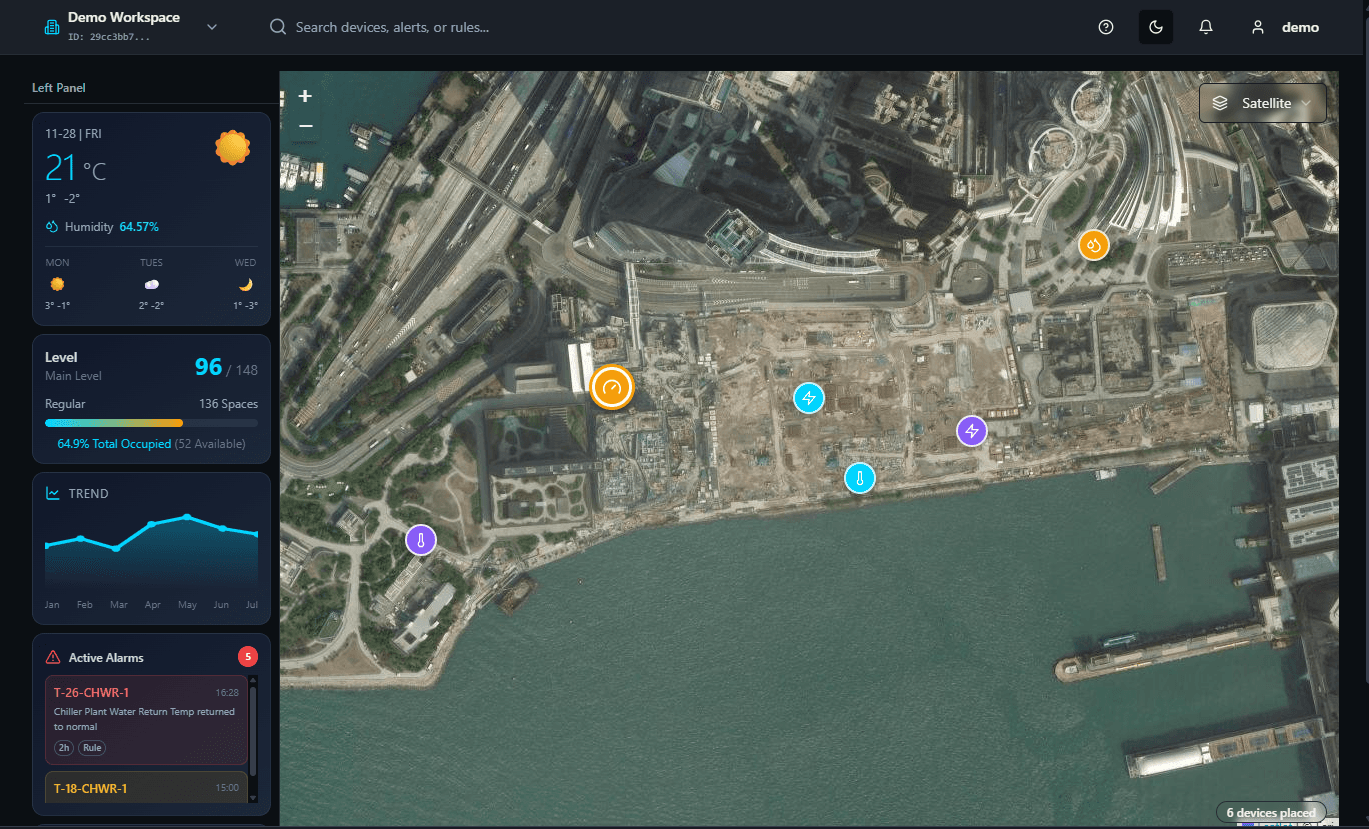
The CONTEXUS GIS Platform brings city-wide IoT infrastructure to life on satellite imagery. See every sensor, meter, and connected device positioned precisely on the map. Monitor environmental conditions, track device health, and respond to alerts—all with geographic context that makes urban management intuitive.
- Satellite view with high-resolution imagery covering harbours, districts, and urban zones
- Colour-coded device icons showing status: energy meters, environmental sensors, and infrastructure
- Space utilisation tracking with real-time occupancy data across monitored zones
- Active alarm panel with priority-ranked alerts for immediate response and escalation
- Weather integration showing real-time temperature (21°C), humidity (64.57%), and forecasts
Satellite View
High-resolution satellite imagery with sensor overlays
Device Localisation
Precise GPS positioning of all IoT devices
Multi-Layer Maps
Toggle between satellite, street, and terrain views
Real-Time Status
Live device status with colour-coded indicators
Unified City Command Centre
The left panel provides weather data, level monitoring, and active alarms. The centre displays your city-wide GIS map with all connected devices. Trend analysis and device counters complete your urban operations view.
Supported Urban IoT Devices
Temperature
Humidity
Air Quality
Energy
Lighting
Traffic
Waste
Security
Smart City Platform Capabilities
GIS Mapping
High-resolution satellite and street map views with seamless zoom from city-wide to individual device level. Support for multiple map layers and custom overlays.
LoRaWAN & Cellular
Multi-protocol connectivity supporting LoRaWAN, NB-IoT, LTE-M, and WiFi for city-wide sensor networks. Automatic network failover ensures reliable data collection.
Real-Time Analytics
Stream processing for instant insights across thousands of sensors. Trend analysis, anomaly detection, and predictive alerts for urban infrastructure.
Alert Management
Geo-fenced alerting with escalation paths. Route alerts to responsible departments based on location and severity. Mobile notifications for field teams.
Environmental Monitoring
Air quality (PM2.5, PM10, CO2, NOx), noise levels, temperature, humidity, and water quality monitoring across urban zones with regulatory compliance.
Smart Lighting
City-wide street lighting management with dimming schedules, motion-based activation, and energy consumption tracking per district.
Traffic & Parking
Vehicle counting, parking occupancy, and traffic flow monitoring. Integration with navigation systems for real-time guidance.
Public Safety
Surveillance camera integration, emergency response triggers, and public announcement system control for enhanced urban safety.
CONTEXUS Modules for Smart City
Integrated modules purpose-built for city-scale IoT deployments and urban intelligence.
Smart City Applications
Municipal Districts
City-wide infrastructure monitoring across multiple districts with unified command centre.
- Multi-district environmental monitoring
- Street lighting across districts
- Waste management optimisation
Industrial Zones
Port, harbour, and industrial area monitoring with specialised environmental sensors.
- Port infrastructure monitoring
- Air quality at industrial sites
- Water quality near harbours
Public Spaces
Parks, plazas, and public venues with crowd monitoring and environmental comfort.
- Crowd density monitoring
- Park lighting and irrigation
- Noise level monitoring
Utility Networks
City-wide utility infrastructure including power, water, and gas network monitoring.
- Smart grid integration
- Water distribution monitoring
- Leak detection alerts
Transportation Hubs
Airports, transit stations, and multimodal transport hubs with integrated monitoring.
- Passenger flow tracking
- Parking guidance systems
- EV charging monitoring
Business Districts
Commercial zones with integrated building and outdoor infrastructure monitoring.
- Multi-building portfolio view
- District energy optimisation
- Shared infrastructure management
Business Value & ROI
Unified City-Wide Visibility
Single platform for monitoring all urban IoT infrastructure. GIS visualisation provides geographic context for faster decision-making and resource allocation.
Reduced Operational Costs
Optimise maintenance routes, reduce energy consumption, and prevent infrastructure failures with predictive analytics across city assets.
Improved Environmental Compliance
Continuous air quality, noise, and water monitoring ensures regulatory compliance with automated reporting for environmental agencies.
Enhanced Public Services
Data-driven insights improve traffic flow, parking availability, waste collection efficiency, and emergency response times.
Scalable Infrastructure
Start with a district and expand city-wide. The platform scales from hundreds to thousands of devices with consistent performance.
Citizen Engagement
Public dashboards share environmental data with citizens. Improve transparency and community trust in city operations.
Smart City Standards & Frameworks Supported
Deploy with confidence — aligned with international smart city standards and national digital transformation programs.
Ready to Deploy City-Wide IoT?
See every sensor on the GIS map and transform how you manage urban infrastructure. Book a demo or explore the IoT Hub platform.
Frequently Asked Questions
What is Smart City Monitoring and how does GIS visualisation work?
Smart City Monitoring is a comprehensive IoT platform that deploys sensors across urban areas and visualises them on GIS (Geographic Information System) maps. CONTEXUS overlays real-time sensor data on satellite imagery, enabling city managers to see device locations, status, and readings directly on interactive maps covering entire districts or city-wide deployments.
What types of IoT devices can be monitored on the city-wide GIS map?
CONTEXUS supports a wide range of urban IoT devices including environmental sensors (air quality, temperature, humidity), smart street lighting, traffic sensors, parking sensors, waste management monitors, water quality sensors, noise monitoring devices, energy meters, and security cameras. Each device type displays with distinctive icons on the GIS map for easy identification.
How does the platform handle large-scale sensor deployments across a city?
The platform is designed for scalability with support for thousands of IoT devices distributed across multiple districts. GIS-based clustering automatically groups nearby sensors at zoom-out levels, while zoom-in reveals individual device locations. Real-time data streaming ensures all sensor readings are current, with alert thresholds triggering notifications for any anomalies.
Can the smart city platform integrate with existing municipal systems?
Yes, CONTEXUS integrates with existing municipal infrastructure including traffic management systems, utility SCADA networks, emergency services, and building management systems. Standard protocols (MQTT, REST APIs, BACnet, Modbus) ensure compatibility with diverse legacy systems while enabling centralised city-wide visibility.
What analytics and reporting capabilities are available for city operations?
The platform provides comprehensive analytics including trend analysis across time periods, comparative district performance, environmental compliance reporting, energy consumption patterns, and predictive maintenance alerts. Customisable dashboards enable different departments (environmental, traffic, utilities) to focus on relevant KPIs while maintaining unified city oversight.